
Alcohol Use Disorder (AUD) in the United States: Age Groups and Demographic Characteristics
Prevalence of Past-Year Alcohol Use Disorder (AUD)
People Ages 12 and Older
Image
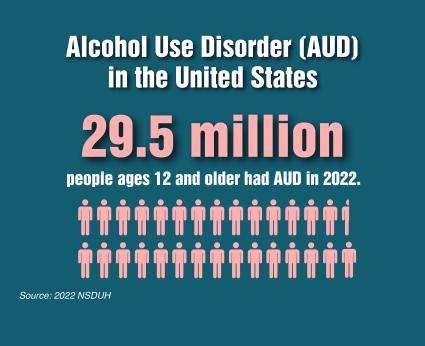
According to the 2022 National Survey on Drug Use and Health (NSDUH), 29.5 million people ages 12 and older (10.5% in this age group) had AUD in the past year.1,2 This includes:
- 17.4 million males ages 12 and older (12.6% in this age group)1,2
- 12.2 million females ages 12 and older (8.5% in this age group)1,2
- 154,000 American Indian or Alaska Native people ages 12 and older (10.5% in this age group)1,2
- 958,000 Asian people ages 12 and older (5.6.% in this age group)1,2
- 3.6 million Black or African American people ages 12 and older (10.5% in this age group)1,2
- 18.6 million White people ages 12 and older (10.9% in this age group)1,2
- 609,000 people of two or more races ages 12 and older (14.7% in this age group)1,2
- 5.5 million Hispanic or Latino people ages 12 and older (10.3% in this age group)1,2
- Estimates for Native Hawaiian or other Pacific Islander people ages 12 and older were not presented because they were based on a relatively small number of respondents or had a large margin of error.1,2
Youth Ages 12 to 17
Image
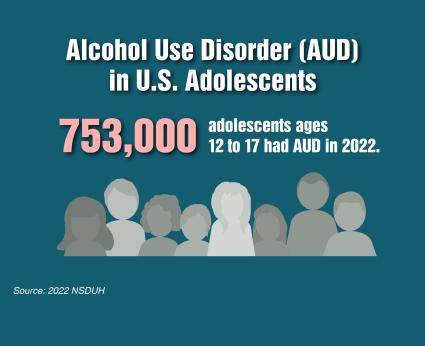
According to the 2022 NSDUH, 753,000 youth ages 12 to 17 (2.9% in this age group) had AUD in the past year.1,2 This includes:
- 281,000 boys ages 12 to 17 (2.1% in this age group)1,2
- 472,000 girls ages 12 to 17 (3.8% in this age group)1,2
- 10,000 American Indian or Alaska Native youth ages 12 to 17 (4.7% in this age group)1,2
- 28,000 Asian youth ages 12 to 17 (1.8% in this age group)1,2
- 55,000 Black or African American youth ages 12 to 17 (1.6% in this age group)1,2
- 406,000 White youth ages 12 to 17 (3.2% in age group)1,2
- 28,000 youth of two or more races ages 12 to 17 (3.5% in this age group)1,2
- 225,000 Hispanic or Latino youth ages 12 to 17 (3.4% in this age group)1,2
- Estimates for Native Hawaiian or other Pacific Islander youth ages 12 to 17 were not presented because they were based on a relatively small number of respondents or had a large margin of error.1,2
Adults Ages 18 and Older
According to the 2022 NSDUH, 28.8 million adults ages 18 and older (11.2% in this age group) had AUD in the past year.1,2 This includes:
- 17.1 million men ages 18 and older (13.6% in this age group)1,2
- 11.7 million women ages 18 and older (8.9% in this age group)1,2
- 143,000 American Indian or Alaska Native adults ages 18 and older (11.5% in this age group)1,2
- 929,000 Asian adults ages 18 and older (6.0% in this age group)1,2
- 3.6 million Black or African American adults ages 18 and older (11.0% in this age group)1,2
- 18.2 million White adults ages 18 and older (11.5% in this age group)1,2
- 580,000 adults of two or more races ages 18 and older (11.5% in this age group)1,2
- 5.3 million Hispanic or Latino adults ages 18 and older (11.9% in this age group)1,2
- Estimates for Native Hawaiian or other Pacific Islander youth ages 12 to 17 were not presented because they were based on a relatively small number of respondents or had a large margin of error.1,2
According to the Substance Abuse and Mental Health Services Administration (SAMHSA), many (but not all) NSDUH estimates from 2022 are comparable with estimates from 2021, as long as updated 2021 estimates, presented in the 2022 Detailed Tables, are used. Please see the 2022 Frequently Asked Questions for more information.