Surveillance Report #112
TRENDS IN ALCOHOL-RELATED MORBIDITY AMONG COMMUNITY HOSPITAL DISCHARGES, UNITED STATES, 2000–2015
Chiung M. Chen, M.A.
Young-Hee Yoon, Ph.D.
CSR, Incorporated1
Suite 500
4250 N. Fairfax Drive
Arlington, VA 22203
August 2018
U.S. Department of Health and Human Services
Public Health Service
National Institutes of Health
1 CSR, Incorporated, operates the Alcohol Epidemiologic Data System (AEDS) under Contract No. HHSN275201300016C for the National Institute on Alcohol Abuse and Alcoholism (NIAAA). Dr. Rosalind A. Breslow (Division of Epidemiology and Prevention Research) serves as the NIAAA Contracting Officer's Representative on the contract.
HIGHLIGHTS
This surveillance report presents trend data on alcohol-related morbidity in the United States that are estimated from inpatient discharges among community hospitals. This is the third in a series of the morbidity surveillance reports that draw data from the National Inpatient Sample (NIS). In 2015, NIS used two different ICD coding systems to record the diagnoses of inpatients in hospitals—the International Classification of Diseases, Ninth Revision, Clinical Modification (ICD-9-CM) codes for the first 9 months (January 1 through September 30) and the International Classification of Diseases, Tenth Revision, Clinical Modification (ICD-10-CM) codes for the last 3 months (October 1 through December 31). However, this report presents the 2015 annual estimates based on only the first 9 months of data in a deliberate attempt to be consistent with prior years of data, which used the ICD-9-CM coding scheme to record diagnoses. It is important to note that NIS implemented a new sampling design to improve national estimates beginning in 2012. This report uses revised discharge weights to make estimates for 2011 and earlier years comparable to those used for 2012 and later years. In NIS, each patient discharge record allowed up to 15 diagnoses before 2009, up to 25 diagnoses between 2009 and 2013, and up to 30 diagnoses after 2013. This change in number of diagnoses per discharge record may potentially increase the numbers and rates of all-listed alcohol-related hospital discharges observed in 2009 and thereafter.
Highlights of general trends from 2000 to 2015 and notable findings are listed below.
Alcohol-Related Hospital Discharges in 2015
- Approximately 412,000 hospital discharges for persons ages 12 and older had a principal (first-listed) alcohol-related diagnosis, and approximately 2.6 million discharges had an any (all-listed) alcohol-related diagnosis. These figures represent 15.12 principal (first-listed) and 94.64 any (all-listed) alcohol-related discharges per 10,000 population.
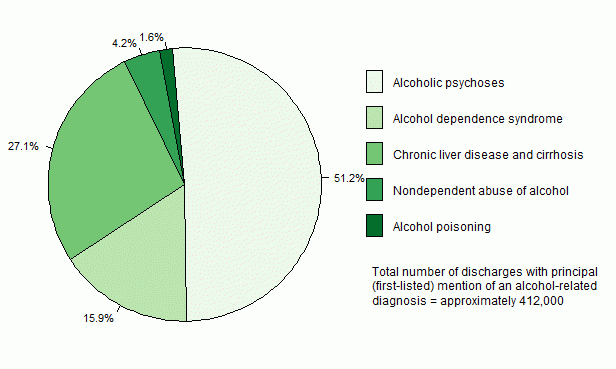
- Alcoholic psychoses were the largest category (51.2 percent) of principal (first-listed) diagnoses, followed by chronic liver disease and cirrhosis (27.1 percent), alcohol dependence syndrome (15.9 percent), nondependent abuse of alcohol (4.2 percent), and alcohol poisoning (1.6 percent).
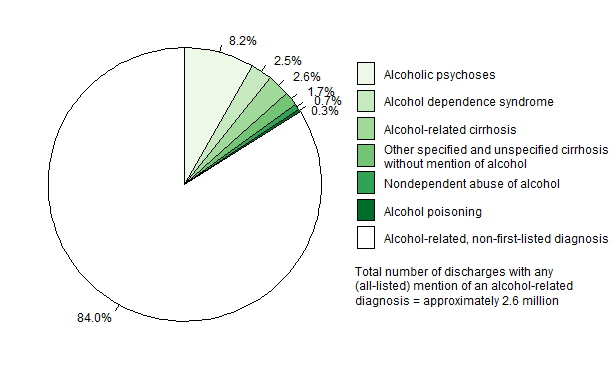
- About 84.0 percent of discharges with any (all-listed) alcohol-related diagnosis did not have an alcohol-related condition listed as their principal (first-listed) diagnosis.
- Alcohol-related diagnoses in decreasing order of severity, as measured by average length of hospital stay, were chronic liver disease and cirrhosis (5.8 days, with 5.9 days for alcohol-related cirrhosis and other specified cirrhosis), alcohol dependence syndrome (5.2 days), alcoholic psychoses (4.5 days), alcohol poisoning (3.5 days), and nondependent abuse of alcohol (2.5 days).
- The aggregate costs for all hospital stays with principal (first-listed) and any (all-listed) mention of an alcohol-related diagnosis were $3.7 billion and $32.5 billion, respectively. The corresponding median cost was higher for stays with an any (all-listed) alcohol-related diagnosis ($7,239) than with a principal (first-listed) alcohol-related diagnosis ($5,216).
General Trends
- Among persons ages 12 and older, the overall rate of hospital discharges with a principal (first-listed) alcohol-related diagnosis remained stable from 2000 to 2015. By contrast, the rate based on any (all-listed) diagnoses increased over this period from 62.45 to 94.64 per 10,000 population, and this increase was particularly salient among persons ages 45 to 64 (from 90.45 to 156.98 per 10,000 population) and persons ages 65 and older (from 77.75 to 123.92 per 10,000 population).
- Hospital discharge rates showed a clear upward trend for both principal (first-listed) and any (all-listed) alcoholic psychoses. There was also an upward trend for any (all-listed) alcohol dependence syndrome, chronic liver disease and cirrhosis, and nondependent abuse of alcohol from 2000 to 2015. By contrast, there was a downward trend for principal (first-listed) alcohol dependence syndrome and slightly less marked downward trends for alcohol-related cirrhosis and nondependent abuse of alcohol during this time period.
- For all alcohol-related diagnoses, except cirrhosis without mention of alcohol and alcohol poisoning, hospital discharge rates continued to be higher for males than for females. Persons ages 45 to 64 generally had the highest rates of hospital discharges, and persons ages 12 to 20 had the lowest.
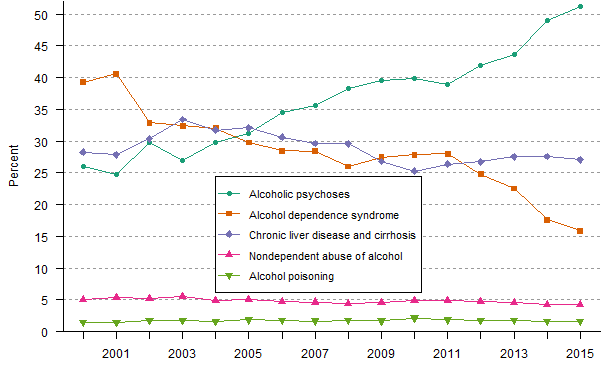
- Alcohol dependence syndrome was the largest category of principal (first-listed) alcohol-related diagnoses before 2003. However, its percentage share declined substantially from 39.3 percent in 2000 to 15.9 percent in 2015. By contrast, the percentage share of alcoholic psychoses increased from 26.0 percent in 2000 to 51.2 percent in 2015, outnumbering any chronic liver disease and cirrhosis and surpassing alcohol dependence syndrome as the largest category of principal (first-listed) alcohol-related diagnoses since 2006.
- The ratio for principal (first-listed) to any (all-listed) alcohol-related discharges declined from 0.25 in 2000 to 0.16 in 2015.
- Between 2000 and 2015, the average length of hospital stays decreased for principal (first-listed) any chronic liver disease and cirrhosis (including alcohol-related cirrhosis) from 6.6 days to 5.8 days but increased for principal (first-listed) alcohol poisoning from 2.3 days to 3.5 days.
INTRODUCTION
This is the 21st surveillance report on trends in alcohol-related morbidity estimated from inpatient discharges among community hospitals in the United States. Prepared by the Alcohol Epidemiologic Data System (AEDS), and Division of Epidemiology and Prevention Research, National Institute on Alcohol Abuse and Alcoholism (NIAAA), this report updates the trends published in earlier surveillance reports. As with the other series of NIAAA surveillance reports, this report is intended to provide useful findings to policymakers, health care providers, researchers, and other individuals concerned about the health effects of harmful alcohol use. The first 18 surveillance reports were based on the National Hospital Discharge Survey (NHDS), which was discontinued in 2011. This report, as well as the previous two reports, draws data from the National (Nationwide) Inpatient Sample (NIS). Although information in both data sources is generally comparable, NIS offers three advantages over NHDS. First, NIS is more than 10 times larger than NHDS. The larger sample can be used to generate more precise estimates for low-incidence medical conditions such as alcohol poisoning (Barrett et al., 2010). Second, NIS allows a much higher number of diagnoses per discharge record than that allowed by NHDS. Third, NIS provides information not available in NHDS on total hospital charges for each hospital stay and cost-to-charge ratios that enables cost estimation and reporting. Using NIS, the current report focuses on trends for 2000–2015. Historical data based on NHDS for 1979–2010 are available online in the 2012 report (https://www.niaaa.nih.gov/publications/surveillance-reports/surveillance94).
This report includes discharge data for patients ages 12 and older as opposed to the previous NHDS-based reports, which included patients ages 15 and older. Data are presented by age and sex, including numbers and population-based rates for hospital discharges with principal (first-listed) mention or any (all-listed) mention of specific diagnoses of alcohol-related diseases and alcohol poisoning. Also included are data on the average length of hospital stay as well as cost estimates in 2015. Race-specific data are not reported because a large proportion of discharge records do not have race information.
To indicate uncertainty in estimates, AEDS uses variance estimation procedures recommended by the Healthcare Cost and Utilization Project (HCUP) to develop 95-percent confidence intervals for each estimate shown in figures 5–9. The values of all estimates are presented in the tables, except those deemed as unreliable according to the HCUP data suppression guidelines (Barrett et al., 2016).
DATA SOURCES
The NIS is part of the HCUP, sponsored by the Agency for Healthcare Research and Quality (AHRQ). It is the largest publicly available all-payer inpatient care database in the United States, including more than 7 million hospital stays each year since 2000. Built from hospital administrative data (i.e., hospital billing records), NIS has been conducted annually since 1988. This report only includes trend data from 2000–2015 because fewer States participated in NIS before 2000. The number of States participating in NIS increased from 8 in 1988 to 17 in 1993, 22 in 1998, 28 in 2000, and 47 in 2015 (AHRQ, 2017). Prior to October 1, 2015, diagnoses in NIS were coded using ICD-9-CM, which was a diagnostic coding scheme published by the Commission on Professional and Hospital Activities (1978) and was based on the World Health Organization’s ninth revision of the ICD (1977). In compliance with the final rule of the U.S. Department of Health and Human Services to implement section 212 of the Protecting Access to Medicare Act of 2014 (https://www.gpo.gov/fdsys/pkg/PLAW-113publ93/pdf/PLAW-113publ93.pdf), beginning on October 1, 2015, diagnoses in NIS have been coded using ICD-10-CM, which was developed by the National Center for Health Statistics (NCHS) for morbidity purposes and was based on the World Health Organization’s tenth revision of the ICD (1992) adopted for mortality reporting in the United States since 1999. Because the transition from the old to the new ICD coding system may cause some abrupt changes that reflect both secular trends and statistical artifacts due to coding rule changes, this report uses only the ICD-9-CM data from the first 9 months of 2015. The annual numbers and rates are derived from the ICD-9-CM data by dividing their discharge weight by 0.75 to avoid the need to develop the ICD-9-CM to ICD-10-CM crosswalk. When more NIS data using ICD-10 become available in the coming years, the crosswalk can be developed using the General Equivalence Mappings (https://www.cms.gov/Medicare/Coding/ICD10/2018-ICD-10-CM-and-GEMs.html), created by the Centers for Medicare and Medicaid Services and the Centers for Disease Control and Prevention.
Prior to 2012, NIS was constructed from a stratified sample of hospitals from the State Inpatient Databases (SID). SID includes all inpatient hospital discharges from community hospitals, identified by the American Hospital Association (AHA) Annual Survey of Hospitals as “all non-Federal, short-term, general, and other specialty hospitals, excluding hospital units of institutions” in participating States. AHA classifies long-term acute-care hospitals as community hospitals if they have an average patient length-of-stay of less than 30 days. The original NIS used a sampling design referred to as stratified, single-stage cluster sampling, by which a stratified random sample of hospitals approximating a 20 percent sample of U.S. community hospitals was drawn from the sampling frame (i.e., SID), and then all discharges from each selected hospital were included. The strata used in creating NIS were census region (Northeast, Midwest, West, or South), location (urban or rural), teaching status (teaching or nonteaching), ownership (government non-Federal or public, private not-for-profit or voluntary, or private investor-owned or proprietary), and bed size (small, medium, or large) based on the number of hospital beds.
To reduce the margin of error for estimates, NIS implemented a new sampling design beginning in 2012 referred to as the systematic sampling design (AHRQ, 2017). This design better represents the entire universe of hospitals and increases the information in the total sample of discharges by drawing a sample of discharge records from all HCUP-participating hospitals. The old design included all discharge records from a sample of hospitals. The new sampling is self-weighted (i.e., each discharge has the same probability of being selected) and accounts for patient characteristics such as diagnoses, age, and admission date as well as hospital characteristics. With this redesign, the definition of the discharge universe was switched from AHA discharge estimates to SID discharge counts. In addition, long-term acute-care hospitals were removed from the hospital universe and hospitals were stratified into nine census divisions rather than four census regions to allow for more refined analyses of geographic variation in U.S. hospitalizations.
The 2012 NIS redesign has affected trend data. Differences between NIS statistics based on the earlier samples (2000–2011) and statistics based on the 2012–2015 samples may be attributed to the modification of the universe of hospitals and discharges rather than the changes in patterns of hospital utilization. Based on the changes implemented in the redesign, AHRQ expects a one-time disruption to the overall trends, with discharge counts declining by about 4.3 percent, average length of stay declining by about 1.5 percent, total hospital charges declining by about 0.5 percent, and hospital mortality declining by about 2.0 percent. To facilitate analysis of trends using multiple years of NIS, AHRQ developed new discharge trend weights for the 1993–2011 NIS (Houchens et al., 2014). These new weights, calculated in the same way as the weights for the redesigned 2012 NIS, are used in this report to make estimates for 2000–2011 comparable to those for 2012–2015.
NIS contains clinical and resource-use information in a typical discharge abstract for each hospital stay, including: primary and secondary diagnoses and procedures, patient demographic characteristics (e.g., sex, age, race, median household income for ZIP Code), hospital characteristics (e.g., ownership), expected payment source, total hospital charges, discharge status, length of stay, and severity and comorbidity measures. For each discharge record, NIS allows up to 25 diagnoses between 2009 and 2013 (15 before 2009) and up to 30 diagnoses beginning with 2014 data (AHRQ, 2017), although the number of diagnoses per record varies across hospitals.
Detailed descriptions of the NIS sample designs, data collection procedures, and data collection instruments used during 2000–2015 can be found in reports (AHRQ, 2002, 2017; Houchens and Elixhauser, 2006; Houchens et al., 2014) published on the HCUP website (http://hcup-us.ahrq.gov/db/nation/nis/nisrelatedreports.jsp).
Mid-year resident population estimates used in calculating hospital discharge rates were prepared by the U.S. Census Bureau. For years 2000 through 2009, population data came from Intercensal Estimates of the Resident Population by Single Year of Age, Sex, Race, and Hispanic Origin for the United States: April 1, 2000, to July 1, 2010 (U.S. Census Bureau, 2011). For years 2010 through 2015, postcensal population data came from Annual Estimates of the Resident Population by Single Year of Age and Sex for the United States: April 1, 2010, to July 1, 2016 (U.S. Census Bureau, 2017).
METHODS
Definitions
This report’s primary methodological challenge is the specification of the categories of alcohol-related diagnoses. The level of diagnostic detail defined in the ICD-9-CM and available in NIS is so great that the most detailed classification of morbidity ends up with having few observations in the diagnostic categories. To minimize the problem of small cell sizes, this report includes detailed NIS diagnostic classifications under five major alcohol-related categories, with three subcategories for chronic liver disease and cirrhosis. These categories (and the associated specific alcohol-related diagnoses) are listed in the “Definition of Alcohol-Related Diagnoses” table below. The fifth category, alcohol poisoning, has been a new addition to the surveillance report since the 2014 issue of the report. It comprises a subset of ICD-9-CM codes for alcohol overdose (White et al., 2011, 2013) and is consistent with the definition used in previous NIAAA publications that included not only toxic effect of alcohol (ICD-9-CM code 980) and accidental poisoning by alcohol (code E860) but also the ill-defined condition, excessive blood level of alcohol (code 790.3) (Caces et al., 1991; Chen et al., 2013). Although not considered as an indication for alcohol poisoning in Alcohol-Related Disease Impact (ARDI) (Centers for Disease Control and Prevention, 2018), code 790.3 could be a proxy measure for alcohol poisoning. Acute alcohol poisoning is more typically a complication of chronic alcohol use disorders (AUD) (Lahti and Vuori 2002); therefore, code 790.3 is grouped within Diagnostic Related Group categories to indicate AUD on the discharge records. The proportion of discharges with a diagnosis of alcohol poisoning involving code 790.3 is extremely small; the addition of this code in this report makes only slight changes to the overall estimates.
| Category Used in Report | Classification in ICD‑9‑CM |
|---|---|
|
Alcoholic psychoses |
291.0 Alcohol withdrawal delirium |
|
Alcohol dependence syndrome |
303.0 Acute alcohol intoxication |
|
Nondependent abuse of alcohol |
305.0 Nondependent alcohol abuse |
|
Chronic liver disease and cirrhosis: Alcohol-related cirrhosis Other specified cirrhosis of the liver without mention of alcohol Unspecified cirrhosis of the liver without mention of alcohol |
571.0 Alcoholic fatty liver 571.4 Chronic hepatitis 571.5 Cirrhosis of liver without mention of alcohol |
|
Alcohol poisoning |
790.3 Excessive blood level of alcohol |
For chronic liver disease and cirrhosis, the ICD-9-CM allows for a distinction between diagnoses with and without mention of alcohol. AEDS has chosen to report not only alcohol-related cirrhosis but also all chronic liver disease and cirrhosis in analyses of alcohol-related morbidity and mortality, following the practice adopted at the recommendation of health professionals and epidemiologists who attended a conference sponsored by AEDS in 1979. Consistent with causes of death reported in other AEDS surveillance reports on cirrhosis mortality (e.g., Yoon and Chen, 2018), this report includes an overall category of chronic liver disease and cirrhosis as well as three subcategories of cirrhosis: (1) alcohol-related cirrhosis, (2) other specified cirrhosis of the liver without mention of alcohol, and (3) unspecified cirrhosis of the liver without mention of alcohol.
For each alcohol-related category, this report presents numbers and rates for principal (first-listed) mention as well as any (all-listed) mention of diagnoses. For each hospital discharge record, the NIS methodology allows for coding up to 15 different diagnoses prior to 2009, up to 25 diagnoses between 2009 and 2013, and up to 30 diagnoses beginning in 2014. The first-listed diagnosis is the principal diagnosis; it is defined in the Uniform Hospital Discharge Data Set as “that condition established after study to be chiefly responsible for occasioning the admission of the patient to the hospital for care.” Additional diagnoses reported in the remaining code positions are other diagnoses defined as “all conditions that coexist at the time of admission, that develop subsequently, or that affect the treatment received and/or the length of stay” (Centers for Disease Control and Prevention, 2011, pp. 90–91). Any (all-listed) mention of diagnoses in this report includes the principal and all other diagnoses appearing on the discharge record, regardless of the order of diagnosis codes. The principal (first-listed) diagnosis need not be the most serious diagnosis recorded on a discharge record, nor is it necessarily the diagnosis that accounts for the overall length of a patient’s hospital stay.
Focusing on principal (first-listed) diagnoses alone overlooks other morbidity that may be diagnosed during the patient’s hospitalization. Principal (first-listed) diagnoses constitute a subset of any (all-listed) diagnoses. Although diagnostic categories based on principal (first-listed) diagnoses are mutually exclusive, a given discharge may appear in more than one category based on any (all-listed) diagnoses. Hospital discharges with multiple diagnoses in the same category are not counted more than once. For example, one diagnostic category is alcoholic psychoses (ICD-9-CM code 291). Under this category are eight subclassifications. A discharge with diagnoses of both alcohol withdrawal delirium (code 291.0) and alcohol withdrawal hallucinosis (code 291.3) would be counted only once under the overall alcoholic psychoses classification even though more than one type of alcoholic psychosis appears on the record.
This report presents data in the following age categories: 12–20, 21–24, 25–44, 45–64, and 65 and older. The age group 12–20 is below the minimum legal drinking age in all 50 States and the District of Columbia, but survey results show that a large number of underage youth drink alcoholic beverages. For example, data from the 2016 National Survey on Drug Use and Health indicate that 8.0 percent of youth ages 12–13, 24.8 percent of youth ages 14–15, 46.7 percent of youth ages 16–17, and 68.3 percent of youth ages 18–20 ever drank alcohol in their lifetime. These data also indicate that 0.3 percent of youth ages 12–13, 3.7 percent of youth ages 14–15, 10.2 percent of youth ages 16–17, and 26.2 percent of youth ages 18–20 ever drank 5 or more drinks (for males) or 4 or more drinks (for females) on the same occasion on at least 1 day in the past 30 days (Center for Behavioral Health Statistics and Quality, 2017).
Exclusions
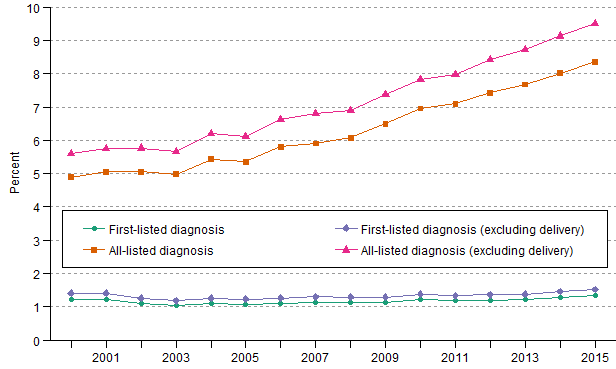
Figure 4 presents the share of all hospital discharges associated with a principal (first-listed) or an any (all-listed) alcohol-related diagnosis. In a typical year, approximately 12 to 13 percent of all hospital discharges among patients ages 12 and older are for childbirth delivery. Because childbirth is not an illness, figure 4 shows the percentage shares in two ways, one by calculating percentages after excluding inpatient deliveries from both the numerator and denominator, and the other by including them. Inpatient deliveries were the discharge records with their principal (first-listed) diagnosis coded as V27, a supplementary ICD-9-CM classification for females delivering babies.
Assessment of Statistical Significance
Because data on hospital discharges are based on a sample of all discharges, there is some sampling error in the estimates presented in this report. To assess the statistical significance of apparent differences in the estimates, AEDS has used the Taylor-series linearization method recommended by AHRQ for variance estimation to develop 95- percent confidence intervals for each estimate (Houchens et al., 2015). Nonoverlapping confidence intervals between estimates can be used to assess whether the difference is statistically significant.
According to the HCUPnet guidelines, statistics based on estimates with a relative standard error (i.e., standard error divided by weighted estimate) greater than 0.30 or with a standard error equal to 0 in the nationwide statistics are not reliable. Therefore, in this report, these statistics are suppressed and are designated with a “–” in the table cells.
Limitations
Estimates based on inpatient discharges among community hospitals only represent a piece of the whole picture of alcohol-related morbidity in the general U.S. population. For example, NIS does not include Veterans Administration and other Federal hospitals, rehabilitation hospitals, or hospitals where the average length of stay is 30 days or longer. Morbidity among people who are not hospitalized, including those who seek outpatient treatment, those who are treated in emergency department settings but not transferred to hospitals, and those who do not seek or receive treatment, is not reflected in this report. If an alcohol-related condition is not related to the reason for hospital admission or does not affect the treatment received and/or the length of stay, the condition is not recorded either as a primary or a secondary diagnosis in the inpatient discharge data. Furthermore, the stigma associated with excessive alcohol use or reluctance of the insurance company to cover those alcohol-related conditions under the Uniform Policy Provision Law prior to the passage of the 2010 Affordable Care Act may have led to some reluctance by health professionals to report an alcohol-related diagnosis (O’Keeffe et al., 2009; Schmidt, 2016).
NIS provides a record for each sampled hospital discharge episode, not for each individual patient; therefore, an unknown portion of discharge episodes may reflect multiple hospital episodes for a single patient in a given year. Because no patient identifiers appear in the NIS public-use data files, it is not possible to identify records for different hospital episodes involving the same patients. Consequently, the numbers and rates reported here reflect the incidence of alcohol-related hospital discharge episodes rather than the prevalence of patients diagnosed with alcohol-related conditions.
Caution is needed when interpreting recent trends in the following areas: (1) The change of NIS sample design in 2012 implies a discontinuity in time-series data, although new discharge trend weights were applied to data from 2000–2001 in an effort to make estimates conform to the new design. (2) The increase in the number of diagnosis codes collected by NIS from 15 to 25 in 2009 and to 30 beginning in 2014 may potentially increase the numbers and rates of all-listed alcohol-related hospital discharges observed in 2009 and thereafter. (3) The annual estimates for 2015 were based on NIS data only from the first 9 months of 2015 under the implicit assumption of no seasonal changes in the last 3 months of 2015. (4) Estimates from NHDS and NIS data sources are not close enough to be presented in continuous trend lines.
REFERENCES
Agency for Healthcare Research and Quality. Changes in the NIS Sampling and Weighting Strategy for 1998. Rockville, MD: Agency for Healthcare Research and Quality, January 2002. Available at https://www.hcup-us.ahrq.gov/db/nation/nis/reports/Changes_in_NIS_Design_1998.pdf. Accessed July 10, 2014.
Agency for Healthcare Research and Quality. Introduction to the HCUP National Inpatient Sample 2015. Rockville, MD: Agency for Healthcare Research and Quality, November 2017. Available at https://www.hcup-us.ahrq.gov/db/nation/nis/NIS_Introduction_2015.pdf. Accessed April 17, 2018.
Barrett, M.; Coffey, R.; Houchens, R.; Moy, E.; Heslin, K.; Moles, E.; and Coenen, N. Methods Applying AHRQ Quality Indicators to Healthcare Cost and Utilization Project (HCUP) Data for the 2015 National Healthcare Quality and Disparities Report (QDR). HCUP Methods Series Report #2016-01. Rockville, MD: Agency for Healthcare Research and Quality, April 12, 2016.
Barrett, M.; Wilson, E.; and Whalen, D. 2007 HCUP Nationwide Inpatient Sample (NIS) Comparison Report. HCUP Methods Series Report #2010-03. Rockville, MD: Agency for Healthcare Research and Quality, September 9, 2010.
Caces, F.; Stinson, F.; and Elliott, S. County Alcohol Problem Indicators, 1979–1985. U.S. Alcohol Epidemiologic Data Reference Manual, Volume 3, Third Edition, Rockville, MD: National Institute on Alcohol Abuse and Alcoholism, 1991.
Chen, C.M.; Yoon, Y-H.; and Yi, H. Alcohol-Related Emergency Department Visits and Hospitalizations and Their Co-Occurring Drug-Related, Mental Health, and Injury Conditions in the United States: Findings from the 2006–2010 Nationwide Emergency Department Sample (NEDS) and Nationwide Inpatient Sample (NIS). U.S. Alcohol Epidemiologic Data Reference Manual, Volume 9, Number 1, NIH Publication No. 13-8000. Bethesda, MD: National Institute on Alcohol Abuse and Alcoholism, 2013
Center for Behavioral Health Statistics and Quality. Results from the 2016 National Survey on Drug Use and Health: Detailed Tables. Rockville, MD: Substance Abuse and Mental Health Services Administration, 2017. Available at https://www.samhsa.gov/data/sites/default/files/NSDUH-DetTabs-2016/NSDUH-DetTabs-2016.pdf. Accessed April 6, 2018.
Centers for Disease Control and Prevention. Alcohol Related Disease Impact (ARDI) Alcohol-Related ICD Codes, 2013. Available at https://nccd.cdc.gov/DPH_ARDI/Info/ICDCodes.aspx. Accessed December 8, 2016.
Centers for Disease Control and Prevention, National Center for Health Statistics (CDC). ICD-9-CM Official Guidelines for Coding and Reporting, 2011. Available at https://www.cdc.gov/nchs/data/icd/icd9cm_guidelines_2011.pdf. Accessed December 8, 2016.
Commission on Professional and Hospital Activities. The International Classification of Diseases, Ninth Revision, Clinical Modification. Ann Arbor, MI, 1978.
Houchens, R.L.; and Elixhauser, A. Using the HCUP Nationwide Inpatient Sample to Estimate Trends. (Updated for 1988–2004). HCUP Methods Series Report #2006-05. Rockville, MD: Agency for Healthcare Research and Quality, August 18, 2006.
Houchens, R.L.; Ross, D.N.; and Elixhauser, A. Final Report on Calculating National Inpatient Sample (NIS) Variances for Data Years 2012 and Later. HCUP Methods Series Report #2015-09. Rockville, MD: Agency for Healthcare Research and Quality, December 14, 2015.
Houchens, R.L.; Ross, D.N.; Elixhauser, A.; and Jiang, J. Nationwide Inpatient Sample Redesign Final Report. Rockville, MD: Agency for Healthcare Research and Quality, April 4, 2014.
Lahti, R.A.; and Vuori, E. Fatal alcohol poisoning: Medico-legal practices and mortality statistics. Forensic Science International, 126(3): 203–209, 2002.
O’Keeffe, T.; Shafi, S.; Sperry, J.L.; and Gentilello, L.M. The implications of alcohol intoxication and the Uniform Policy Provision Law on trauma centers: A national trauma data bank analysis of minimally injured patients. Journal of Trauma, 66(2): 495–498, 2009.
Schmidt, L.A. Recent developments in alcohol services research on access to care. Alcohol Research: Current Reviews, 38(1): 27–33, 2016.
U.S. Census Bureau. Annual Estimates of the Resident Population by Single Year of Age and Sex for the United States: April 1, 2010, to July 1, 2016 [data file]. Washington, DC: Author, 2017. Available at https://www2.census.gov/programs-surveys/popest/datasets/2010-2016/national/asrh/. Accessed February 13, 2018.
U.S. Census Bureau. Intercensal Estimates of the Resident Population by Sex and Age for the United States: April 1, 2000 to July 1, 2010 [data file]. Washington, DC: Author, 2011. Available at http://www2.census.gov/programs-surveys/popest/datasets/2000-2010/intercensal/national/. Accessed December 21, 2016.
White, A.M.; Hingson, R.W; MacInnes, E.; and Pan, I-J. Hospitalizations for suicide-related drug poisonings and co-occurring alcohol overdoses in adolescents (ages 12–17) and young adults (ages 18–24) in the United States, 1999–2008: Results from the Nationwide Inpatient Sample. Suicide and Life-Threatening Behavior, 43(2):198–212, 2013.
White, A.M.; Hingson, R.W.; Pan, I-J.; and Yi, H. Hospitalizations for alcohol and drug overdoses in young adults aged 18–24 in the United States, 1999–2008: Results from the Nationwide Inpatient Sample. Journal of Studies on Alcohol and Drugs, 72(5):774–86, 2011.
World Health Organization. International Classification of Diseases and Related Health Problems, Tenth Revision. Geneva, Switzerland: WHO, 1992.
World Health Organization. Manual of the International Statistical Classification of Diseases, Injuries, and Causes of Death, Ninth Revision. Geneva, Switzerland: WHO, 1977.
Yoon, Y.H.; and Chen, C.M. Surveillance Report #111: Liver Cirrhosis Mortality in the United States: National, State, and Regional Trends, 2000–2015. Bethesda, MD: National Institute on Alcohol Abuse and Alcoholism, Division of Epidemiology and Prevention Research, 2018
List of Figures
Figure 1. Percent distribution of principal (first-listed) diagnoses among discharges with principal (first-listed) mention of an alcohol-related diagnosis for U.S. population ages 12 and older, 2015.
Figure 2. Trends in percent distribution of principal (first-listed) diagnoses among discharges with principal (first-listed) mention of an alcohol-related diagnosis for U.S. population ages 12 and older, 2000–2015.
Figure 3. Percent distribution of principal (first-listed) diagnoses among discharges with any (all-listed) mention of an alcohol-related diagnosis for U.S. population ages 12 and older, 2015.
Figure 4. Trends in percent of discharges with principal (first-listed) or any (all-listed) mention of an alcohol-related diagnosis among all discharges for U.S. population ages 12 and older, 2000–2015.
Figure 5. Rates and 95-percent confidence intervals for discharges with principal (first-listed) mention of an alcohol-related diagnosis for U.S. population ages 12 and older, 2000–2015.
Figure 6. Rates and 95-percent confidence intervals for discharges with any (all-listed) mention of an alcohol-related diagnosis for U.S. population ages 12 and older, 2000–2015.
Figure 7. Rates and 95-percent confidence intervals for discharges with principal (first-listed) mention of specific alcohol-related diagnoses for U.S. population ages 12 and older, 2000–2015.
Figure 8. Rates and 95-percent confidence intervals for discharges with any (all-listed) mention of specific alcohol-related diagnoses for U.S. population ages 12 and older, 2000–2015.
Figure 9. Average length of stay and 95-percent confidence intervals for discharges with principal (first-listed) mention of specific alcohol-related diagnoses for U.S. population ages 12 and older, 2000–2015.
List of Tables
Table 1. Number and rate of discharges with principal (first-listed) mention of an alcohol-related diagnosis for U.S. population ages 12 and older, by sex and age group, 2000–2015.
Table 2. Number and rate of discharges with any (all-listed) mention of an alcohol-related diagnosis for U.S. population ages 12 and older, by sex and age group, 2000–2015.
Table 3. Average length of stay (in days) for discharges with principal (first-listed) mention of an alcohol-related diagnosis for U.S. population ages 12 and older, by sex and age group, 2000–2015.
Table 4. Total and median costs for hospital stays with principal (first-list) or any (all-listed) mention of an alcohol-related diagnosis for U.S. population ages 12 and older, by sex and age group, 2015.
Figure 1. Percent distribution of principal (first-listed) diagnoses among discharges with principal (first-listed) mention of an alcohol-related diagnosis for U.S. population ages 12 and older, 2015.
Data for figure 1 are presented in the following page.
Figure 2. Trends in percent distribution of principal (first-listed) diagnoses among discharges with principal (first-listed) mention of an alcohol-related diagnosis for U.S. population ages 12 and older, 2000–2015.
Data for figure 2 are presented in the following page.
Figure 3. Percent distribution of principal (first-listed) diagnoses among discharges with any (all-listed) mention of an alcohol-related diagnosis for U.S. population ages 12 and older, 2015.
Data for figure 3 are presented in the following page.
Figure 4. Trends in percent of discharges with principal (first-listed) or any (all-listed) mention of an alcohol-related diagnosis among all discharges
for U.S. population ages 12 and older, 2000–2015.
Data for figure 4 are presented in the following page.
Figure 5. Rates and 95-percent confidence intervals for discharges with principal (first-listed) mention of an alcohol-related diagnosis for U.S. population ages 12 and older, 2000–2015.
[Vertical axes reflect rates per 10,000 population]
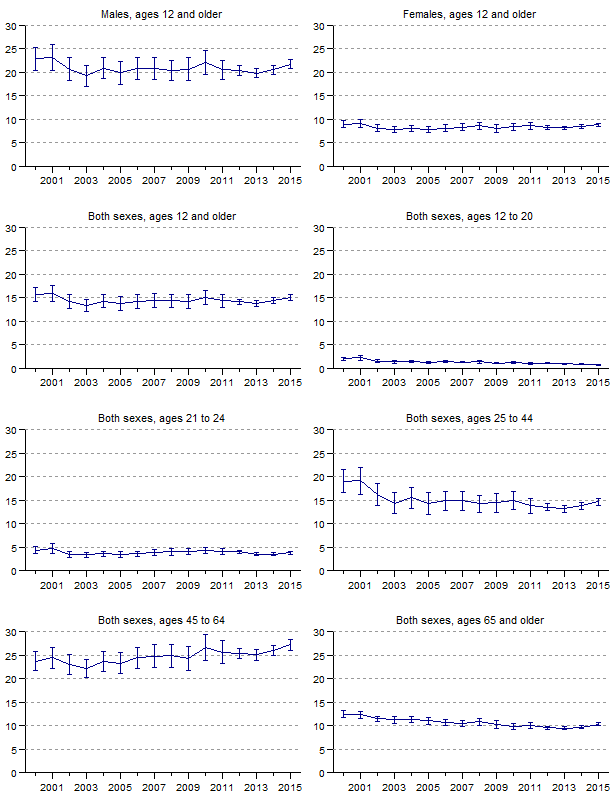
Data for figure 5 are presented in Table 1.
Figure 6. Rates and 95-percent confidence intervals for discharges with any (all-listed) mention of an alcohol-related diagnosis for U.S. population ages 12 and older, 2000–2015.
[Vertical axes reflect rates per 10,000 population]
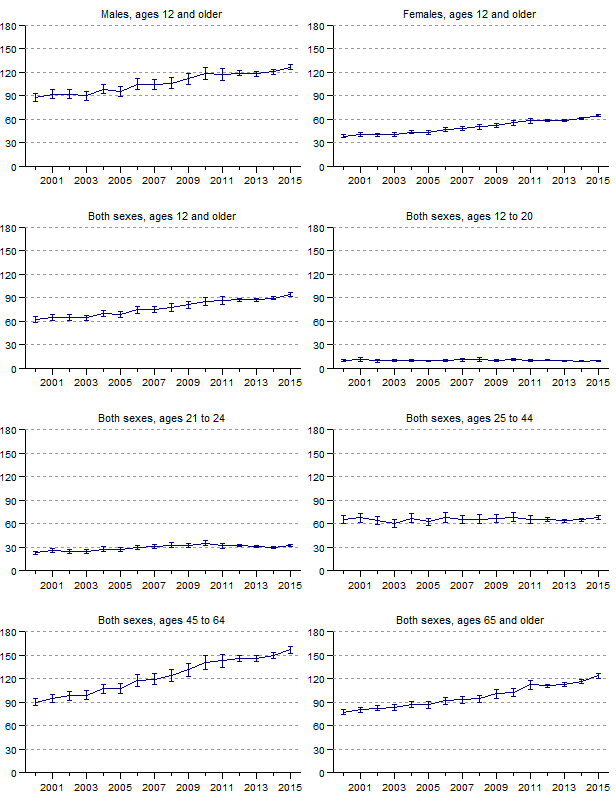
Data for figure 6 are presented in Table 2.
Figure 7. Rates and 95-percent confidence intervals for discharges with principal (first-listed) mention of specific alcohol-related diagnoses for U.S. population ages 12 and older, 2000–2015.
[Vertical axes reflect rates per 10,000 population: scale is not uniform for all graphs]
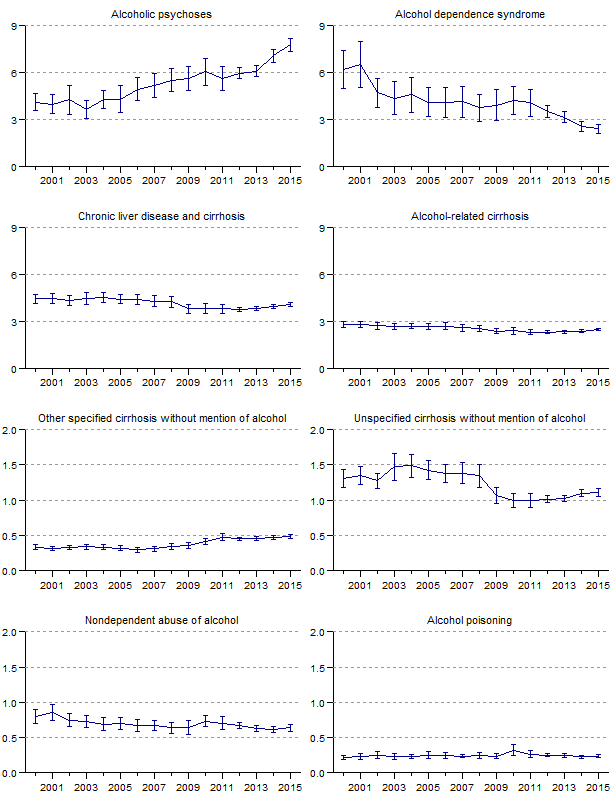
Data for figure 7 are presented in Table 1.
Figure 8. Rates and 95-percent confidence intervals for discharges with any (all-listed) mention of specific alcohol-related diagnoses for U.S. population ages 12 and older, 2000–2015.
[Vertical axes reflect rates per 10,000 population: scale is not uniform for all graphs]
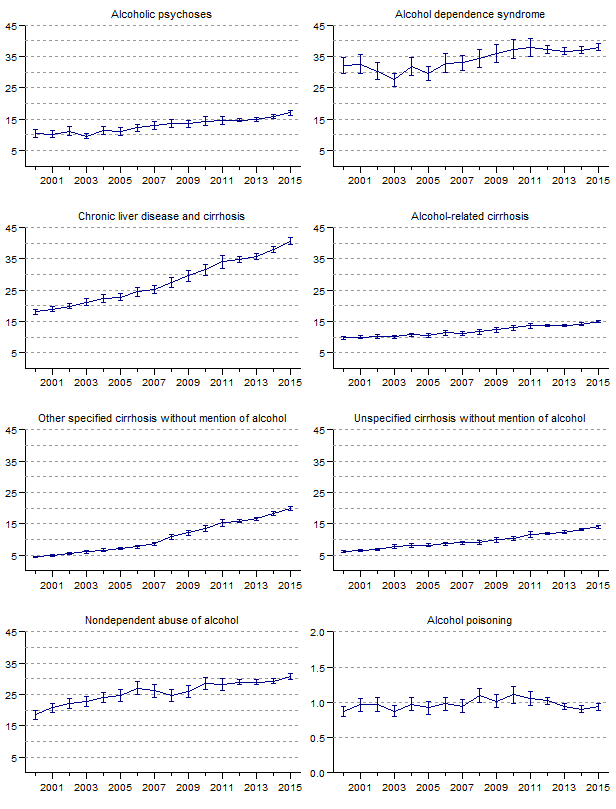
Data for figure 8 are presented in Table 2.
Figure 9. Average length of stay and 95-percent confidence intervals for discharges with principal (first-listed) mention of specific alcohol-related diagnoses for U.S. population ages 12 and older, 2000–2015.
[Vertical axes reflect average length of stay in days]
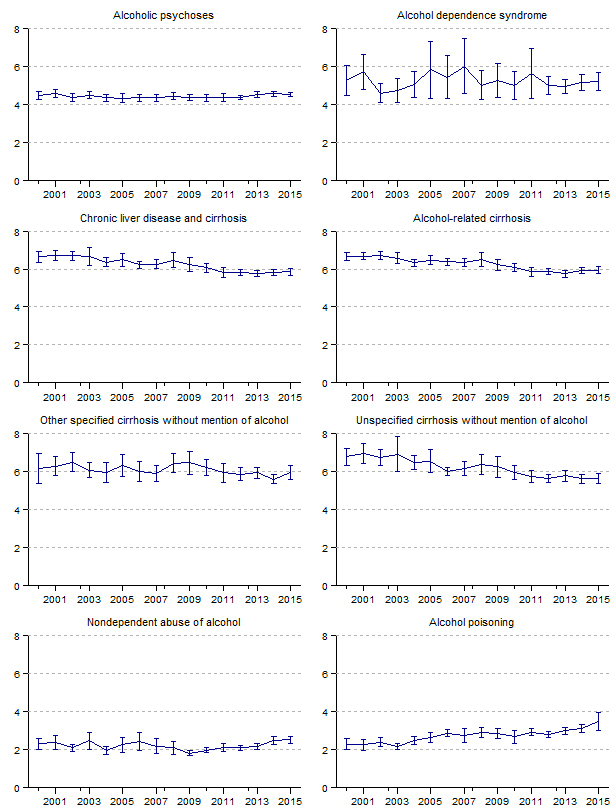
Data for figure 9 are presented in Table 3.

