Updated: 2023

Prevalence of Alcohol Use

Prevalence of Past-Month Drinking

According to the 2021 National Survey on Drug Use and Health (NSDUH), 16.6 million young adults ages 18 to 25 (49.7% in this age group) reported that they drank alcohol in the past month.1,2 This includes:

  • 8.1 million males ages 18 to 25 (48.5% in this age group)1,2
  • 8.7 million females ages 18 to 25 (51.8% in this age group)1,2
  • 10.1 million White young adults ages 18 to 25 (57.2% in this age group)1,2
  • 1.8 million Black or African American young adults ages 18 to 25 (39.8% in this age group)1,2
  • 643,000 Asian young adults ages 18 to 25 (32.9% in this age group)1,2
  • 430,000 young adults of two or more races ages 18 to 25 (47.2% in this age group)1,2
  • 3.5 million Hispanic or Latino young adults ages 18 to 25 (44.8% in this age group)1,2
  • 4.8 million full-time college students ages 18 to 25 (51.8%) and 11.8 million other persons of the same age (49.0%)3
  • Estimates for American Indian or Alaska Native and Native Hawaiian or other Pacific Islander young adults ages 18 to 25 were not presented because they were based on a relatively small number of respondents or had a large margin of error.1,2

Prevalence of Past-Month Binge Drinking

According to the 2021 NSDUH, 9.8 million young adults ages 18 to 25 (29.2% in this age group) reported binge drinking in the past month (see glossary for definition of binge drinking).4,5 This includes:
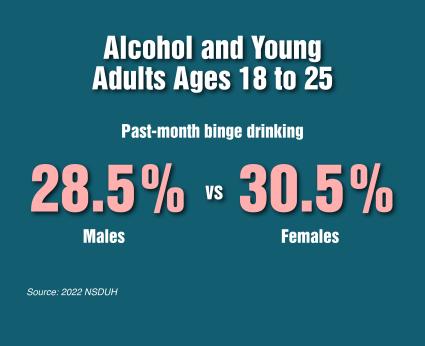
  • 4.7 million males ages 18 to 25 (27.8% in this age group)4,5
  • 5.1 million females ages 18 to 25 (30.5% in this age group)4,5
  • 5.9 million White young adults ages 18 to 25 (33.6% in this age group)4,5
  • 994,000 Black or African American young adults ages 18 to 25 (21.8% in this age group)4,5
  • 336,000 Asian young adults ages 18 to 25 (17.2% in this age group)4,5
  • 269,000 young adults of two or more races ages 18 to 25 (29.6% in this age group)4,5
  • 2.1 million Hispanic or Latino young adults ages 18 to 25 (26.3% in this age group)4,5
  • 2.7 million full-time college students ages 18 to 25 (28.7%) and 7.1 million other persons of the same age (29.3%)3
  • Estimates for American Indian or Alaska Native and Native Hawaiian or other Pacific Islander young adults ages 18 to 25 were not presented because they were based on a relatively small number of respondents or had a large margin of error.4,5

Prevalence of Past-Month Heavy Alcohol Use

According to the 2021 NSDUH, 2.4 million young adults ages 18 to 25 (7.2% in this age group) reported heavy alcohol use in the past month (see glossary for definition of heavy alcohol use).6,7 This includes:

  • 1.3 million males ages 18 to 25 (7.7% in this age group)6,7
  • 1.1 million females ages 18 to 25 (6.5% in this age group)6,7
  • 1.6 million White young adults ages 18 to 25 (9.0% in this age group)6,7
  • 259,000 Black or African American young adults ages 18 to 25 (5.7% in this age group)6,7
  • 86,000 Asian young adults ages 18 to 25 (4.4% in this age group)6,7
  • 53,000 young adults of two or more races ages 18 to 25 (5.9% in this age group)6,7
  • 350,000 Hispanic or Latino young adults ages 18 to 25 (4.5% in this age group)6,7
  • 700,000 full-time college students ages 18 to 25 (7.3%) and 1.7 million other persons of the same age (7.2%)3
  • Estimates for American Indian or Alaska Native and Native Hawaiian or other Pacific Islander young adults ages 18 to 25 were not presented because they were based on a relatively small number of respondents or had a large margin of error.6,7

Prevalence of High-Intensity Drinking

According to the 2019 Monitoring the Future (MTF) survey, 12.0% of college students and 12.0% of young adults not in college engaged in high-intensity drinking (see the MTF bullet in the glossary definition of high-intensity drinking).8

Consequences of Alcohol Use

  • Alcohol is a factor in the deaths of thousands of young people every year in the United States. The most recent National Institute on Alcohol Abuse and Alcoholism statistics estimate that this includes 1,519 college students ages 18 to 24 and 2,586 persons the same age who die from alcohol-related unintentional injuries, including motor vehicle crashes.9
  • According to the 2021 NSDUH, 14.9% of adults ages 18 to 25 met the criteria for past-year alcohol use disorder (AUD).10 Within this age group, 13.8% of full-time college students ages 18 to 25 and 15.3% of other persons of the same age met the criteria for AUD.11
  • Although estimating the number of alcohol-related sexual assaults is exceptionally challenging because sexual assault is typically underreported, researchers have confirmed a long-standing finding that 1 in 5 college women experience sexual assault during their time in college.12 A majority of sexual assaults in college involve alcohol or other substances.13,14 Research continues to better understand the relationship between alcohol and sexual assault among college students. Additional national survey data are needed to better estimate the number of alcohol-related assaults.
According to the Substance Abuse and Mental Health Services Administration (SAMHSA), caution should be used when comparing estimates from the 2020 and 2021 NSDUH to those from prior years due to methodological changes. Prior to the COVID-19 pandemic, data for NSDUH were collected during in-home visits, using computer-assisted techniques. The COVID-19 pandemic necessitated a delay in data collection during 2020 and the introduction of web-based data collection, with very limited in-person data collection. Because these changes in data collection coincided with the spread of the COVID-19 pandemic and any related behavioral or mental health changes, we cannot fully separate the effects of methodological changes from true changes in the outcomes. Please see the Methodological Summary and Definitions [PDF – 4 MB] for more information.

References

  1. SAMHSA, Center for Behavioral Health Statistics and Quality. 2021 National Survey on Drug Use and Health. Table 2.27A—Alcohol use in past month: among people aged 12 or older; by age group and demographic characteristics, numbers in thousands, 2021. [cited 2023 Jan 11]. Available from: https://www.samhsa.gov/data/sites/default/files/reports/rpt39441/NSDUHDetailedTabs2021/NSDUHDetailedTabs2021/NSDUHDetTabsSect2pe2021.htm#tab2.27a 
  2. SAMHSA, Center for Behavioral Health Statistics and Quality. 2021 National Survey on Drug Use and Health. Table 2.27B—Alcohol use in past month: among people aged 12 or older; by age group and demographic characteristics, percentages, 2021. [cited 2023 Jan 11]. Available from: https://www.samhsa.gov/data/sites/default/files/reports/rpt39441/NSDUHDetailedTabs2021/NSDUHDetailedTabs2021/NSDUHDetTabsSect2pe2021.htm#tab2.27b 
  3. The estimates are weighted by the person-level analysis weight and derived from the CBHSQ 2021 National Survey on Drug Use and Health (NSDUH-2021-DS0001) public-use data file. Past-month alcohol use: a drink of an alcoholic beverage (a can or bottle of beer, a glass of wine or a wine cooler, a shot of distilled spirits, or a mixed drink with distilled spirits in it), not counting a sip or two from a drink in the past 30 days. Past-month binge alcohol use: five or more drinks on the same occasion for males or four or more drinks on the same occasion for females on at least 1 day in the past 30 days. Past-month heavy alcohol use: five or more drinks on the same occasion for males or four or more drinks on the same occasion for females on each of 5 or more days in the past 30 days. Full-time college students: full-time students ages 18 to 25 enrolled in school at the college level. Other persons ages 18 to 25: those not enrolled in school, enrolled in college part time, enrolled in other grades either full or part time, or enrolled with no other information available.
  4. SAMHSA, Center for Behavioral Health Statistics and Quality. 2021 National Survey on Drug Use and Health. Table 2.28A—Binge alcohol use in past month: among people aged 12 or older; by age group and demographic characteristics, numbers in thousands, 2021. [cited 2023 Jan 11]. Available from: https://www.samhsa.gov/data/sites/default/files/reports/rpt39441/NSDUHDetailedTabs2021/NSDUHDetailedTabs2021/NSDUHDetTabsSect2pe2021.htm#tab2.28a 
  5. SAMHSA, Center for Behavioral Health Statistics and Quality. 2021 National Survey on Drug Use and Health. Table 2.28B—Binge alcohol use in past month: among people aged 12 or older; by age group and demographic characteristics, percentages, 2021. [cited 2023 Jan 11]. Available from: https://www.samhsa.gov/data/sites/default/files/reports/rpt39441/NSDUHDetailedTabs2021/NSDUHDetailedTabs2021/NSDUHDetTabsSect2pe2021.htm#tab2.28b 
  6. SAMHSA, Center for Behavioral Health Statistics and Quality. 2021 National Survey on Drug Use and Health. Table 2.29A—Heavy alcohol use in past month: among people aged 12 or older; by age group and demographic characteristics, numbers in thousands, 2021. [cited 2023 Jan 11]. Available from: https://www.samhsa.gov/data/sites/default/files/reports/rpt39441/NSDUHDetailedTabs2021/NSDUHDetailedTabs2021/NSDUHDetTabsSect2pe2021.htm#tab2.29a 
  7. SAMHSA, Center for Behavioral Health Statistics and Quality. 2021 National Survey on Drug Use and Health. Table 2.29B—Heavy alcohol use in past month: among people aged 12 or older; by age group and demographic characteristics, percentages, 2021. [cited 2023 Jan 11]. Available from: https://www.samhsa.gov/data/sites/default/files/reports/rpt39441/NSDUHDetailedTabs2021/NSDUHDetailedTabs2021/NSDUHDetTabsSect2pe2021.htm#tab2.29b
  8. Schulenberg JE, Patrick ME, Johnston LD, O’Malley PM, Bachman JG, Miech RA. Monitoring the Future National Survey Results on Drug Use, 1975–2020. College students and adults ages 19–60. Ann Arbor (MI): Institute for Social Research, University of Michigan; 2021 July. 2 vol. Research Grant No.: R01 DA 001411 and R01 DA 016575. https://monitoringthefuture.org/wp-content/uploads/2022/08/mtf-vol2_2020.pdf
  9. Methodology for arriving at estimates described in Hingson R, Zha W, Smyth D. Magnitude and trends in heavy episodic drinking, alcohol-impaired driving, and alcohol-related mortality and overdose hospitalizations among emerging adults of college ages 18–24 in the United States, 1998–2014. J Stud Alcohol Drugs. 2017;78(4):540-8. PubMed PMID: 28728636 
  10. SAMHSA, Center for Behavioral Health Statistics and Quality. 2021 National Survey on Drug Use and Health. Table 5.6B—Alcohol use disorder in past year: among people aged 12 or older; by age group and demographic characteristics, percentages, 2021. [cited 2023 Jan 11]. Available from: https://www.samhsa.gov/data/sites/default/files/reports/rpt39441/NSDUHDetailedTabs2021/NSDUHDetailedTabs2021/NSDUHDetTabsSect5pe2021.htm#tab5.6b 
  11. The estimates are weighted by the person-level analysis weight and derived from CBHSQ 2021 National Survey on Drug Use and Health (NSDUH-2021-DS0001) public use data file. Past-year AUD: having met two or more of the 11 AUD diagnostic criteria in the past-year according to the 5th edition of the Diagnostic and Statistical Manual of Mental Disorders. Full-time college students: full-time students ages 18 to 25 enrolled in school at the college level. Other persons ages 18 to 25: those not enrolled in school, enrolled in college part-time, enrolled in other grades either full- or part-time, or enrolled with no other information available.
  12. Muehlenhard CL, Peterson ZD, Humphreys TP, Jozkowski KN. Evaluating the one-in-five statistic: women's risk of sexual assault while in college. J Sex Res. 2017;54(4-5):549-76. PubMed PMID: 28375675
  13. Carey KB, Durney SE, Shepardson RL, Carey MP. Incapacitated and forcible rape of college women: prevalence across the first year. J Adolesc Health. 2015;56(6):678-80. PubMed PMID: 26003585
  14. Lawyer S, Resnick H, Bakanic V, Burkett T, Kilpatrick D. Forcible, drug-facilitated, and incapacitated rape and sexual assault among undergraduate women. J Am Coll Health. 2010;58(5):453-60. PubMed PMID: 20304757
Back to Top