
Alcohol Use in the United States: Age Groups and Demographic Characteristics
Prevalence of Lifetime Drinking
People Ages 12 and Older
According to the 2022 National Survey on Drug Use and Health (NSDUH), 221.3 million people ages 12 and older (78.5% in this age group) reported that they drank alcohol at some point in their lifetime.1,2 This includes:
- 110.2 million males ages 12 and older (79.7% in this age group)1,2
- 111.1 million females ages 12 and older (77.3% in this age group)1,2
- 976,000 American Indian or Alaska Native people ages 12 and older (66.7% in this age group)1,2
- 10.1 million Asian people ages 12 and older (59.1% in this age group)1,2
- 24.1 million Black or African American people ages 12 and older (69.8% in this age group)1,2
- 144.1 million White people ages 12 and older (84.2% in this age group)1,2
- 4.5 million people of two or more races ages 12 and older (76.0% in this age group)1,2
- 36.8 million Hispanic or Latino people ages 12 and older (72.3% in this age group)1,2
- Estimates for Native Hawaiian or other Pacific Islander people ages 12 and older were not presented because they were based on a relatively small number of respondents or had a large margin of error.1,2
Youth Ages 12 to 17
According to the 2022 NSDUH, 5.7 million youth ages 12 to 17 (22.3% in this age group) reported that they drank alcohol at some point in their lifetime.1,2 This includes:
- 2.7 million boys ages 12 to 17 (20.2% in this age group)1,2
- 3.1 million girls ages 12 to 17 (24.5% in this age group)1,2
- 53,000 American Indian or Alaska Native people ages 12 to 17 (24.2% in this age group)1,2
- 173,000 Asian youth ages 12 to 17 (10.8% in this age group)1,2
- 610,000 Black or African American youth ages 12 to 17 (17.4% in this age group)1,2
- 3.2 million White youth ages 12 to 17 (24.5% in this age group)1,2
- 195,000 youth of two or more races ages 12 to 17 (23.4% in this age group)1,2
- 1.5 million Hispanic or Latino youth ages 12 to 17 (23.3% in this age group)1,2
- Estimates for Native Hawaiian or other Pacific Islander youth ages 12 to 17 were not presented because they were based on a relatively small number of respondents or had a large margin of error.1,2
Adults Ages 18 and Older
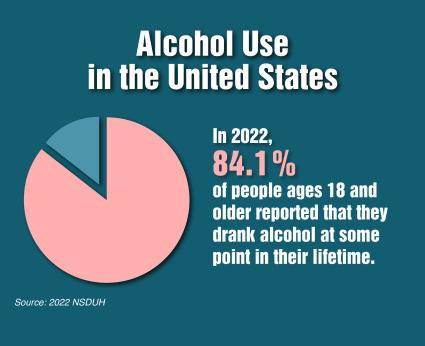
According to the 2022 NSDUH, 215.6 million adults ages 18 and older (84.1% in this age group) reported that they drank alcohol at some point in their lifetime.1,2 This includes:
- 107.5 million men ages 18 and older (85.9% in this age group)1,2
- 108.1 million women ages 18 and older (82.4% in this age group)1,2
- 922,000 American Indian or Alaska Native adults ages 18 and older (74.2% in this age group)1,2
- 9.9 million Asian adults ages 18 and older (64.2% in this age group)1,2
- 23.4 million Black or African American adults ages 18 and older (75.8% in this age group)1,2
- 140.9 million White adults ages 18 and older (89.1% in this age group)1,2
- 4.3 million adults of two or more races ages 18 and older (84.6% in this age group)1,2
- 35.3 million Hispanic or Latino adults ages 18 and older (79.7% in this age group)1,2
- Estimates for Native Hawaiian or other Pacific Islander adults ages 18 and older were not presented because they were based on a relatively small number of respondents or had a large margin of error.1,2
Prevalence of Past-Year Drinking

People Ages 12 and Older
According to the 2022 NSDUH, 177.0 million people ages 12 and older (62.8% in this age group) reported that they drank in the past year.3,4 This includes:
- 89.0 million males ages 12 and older (64.4% in this age group)3,4
- 88.0 million females ages 12 and older (61.2% in this age group)3,4
- 688,000 American Indian or Alaska Native people ages 12 and older (47.1% in this age group)3,4
- 8.3 million Asian people ages 12 and older (49.1% in this age group)3,4
- 18.8 million Black or African American people ages 12 and older (54.6% in this age group)3,4
- 114.8 million White people ages 12 and older (67.1% in this age group)3,4
- 3.5 million people of two or more races ages 12 and older (60.4% in this age group)3,4
- 30.2 million Hispanic or Latino people ages 12 and older (59.3% in this age group)3,4
- Estimates for Native Hawaiian or other Pacific Islander people ages 12 and older were not presented because they were based on a relatively small number of respondents or had a large margin of error.3,4
Youth Ages 12 to 17
According to the 2022 NSDUH, 4.3 million youth ages 12 to 17 (16.7% in this age group) reported that they drank in the past year.3,4 This includes:
- 1.9 million boys ages 12 to 17 (14.7% in this age group)3,4
- 2.4 million girls ages 12 to 17 (18.9% in this age group)3,4
- 35,000 American Indian or Alaska Native youth ages 12 to 17 (15.9% in this age group)3,4
- 135,000 Asian youth ages 12 to 17 (8.4% in this age group)3,4
- 396,000 Black or African American youth ages 12 to 17 (11.3% in this age group)3,4
- 2.5 million White youth ages 12 to 17 (19.3% in this age group)3,4
- 150,000 youth of two or more races ages 12 to 17 (18.0% in this age group)3,4
- 1.1 million Hispanic or Latino youth ages 12 to 17 (16.5% in this age group)3,4
- Estimates for Native Hawaiian or other Pacific Islander youth ages 12 to 17 were not presented because they were based on a relatively small number of respondents or had a large margin of error.3,4
Adults Ages 18 and Older
According to the 2022 NSDUH, 172.7 million adults ages 18 and older (67.4% in this age group) reported that they drank in the past year.3,4 This includes:
- 87.1 million men ages 18 and older (69.6% in this age group)3,4
- 85.6 million women ages 18 and older (65.3% in this age group)3,4
- 653,000 American Indian or Alaska Native adults ages 18 and older (52.6% in this age group)3,4
- 8.2 million Asian adults ages 18 and older (53.3% in this age group)3,4
- 18.4 million Black or African American adults ages 18 and older (59.6% in this age group)3,4
- 112.4 million White adults ages 18 and older (71.0% in this age group)3,4
- 3.4 million adults of two or more races ages 18 and older (67.4% in this age group)3,4
- 29.1 million Hispanic or Latino adults ages 18 and older (65.8% in this age group)3,4
- Estimates for Native Hawaiian or other Pacific Islander adults ages 18 and older were not presented because they were based on a relatively small number of respondents or had a large margin of error.3,4
Prevalence of Past-Month Drinking
People Ages 12 and Older
According to the 2022 NSDUH, 137.4 million people ages 12 and older (48.7% in this age group) reported that they drank in the past month.5,6 This includes:
- 71.0 million males ages 12 and older (51.4% in this age group)5,6
- 66.4 million females ages 12 and older (46.2% in this age group)5,6
- 520,000 American Indian or Alaska Native people ages 12 and older (35.5% in this age group)5,6
- 6.3 million Asian people ages 12 and older (36.7% in this age group)5,6
- 14.3 million Black or African American people ages 12 and older (41.6% in this age group)5,6
- 91.3 million White people ages 12 and older (53.4% in this age group)5,6
- 2.5 million people of two or more races ages 12 and older (42.7% in this age group)5,6
- 22.2 million Hispanic or Latino people ages 12 and older (43.6% in this age group)5,6
- Estimates for Native Hawaiian or other Pacific Islander people ages 12 and older were not presented because they were based on a relatively small number of respondents or had a large margin of error.5,6
Youth Ages 12 to 17
According to the 2022 NSDUH, 1.8 million youth ages 12 to 17 (6.8% in this age group) reported that they drank in the past month.5,6 This includes:
- 708,000 boys ages 12 to 17 (5.4% in this age group)5,6
- 1.0 million girls ages 12 to 17 (8.3% in this age group)5,6
- 12,000 American Indian or Alaska Native youth ages 12 to 17 (5.4% in this age group)5,6
- 36,000 Asian youth ages 12 to 17 (2.2% in this age group)5,6
- 124,000 Black or African American youth ages 12 to 17 (3.5% in this age group)5,6
- 1.1 million White youth ages 12 to 17 (8.3% in this age group)5,6
- 61,000 youth of two or more races ages 12 to 17 (7.3% in this age group)5,6
- 444,000 Hispanic or Latino youth ages 12 to 17 (6.7% in this age group)5,6
- Estimates for Native Hawaiian or other Pacific Islander youth ages 12 to 17 were not presented because they were based on a relatively small number of respondents or had a large margin of error.5,6
Adults Ages 18 and Older
According to the 2022 NSDUH, 135.7 million adults ages 18 and older (52.9% in this age group) reported that they drank in the past month.5,6 This includes:
- 70.3 million men ages 18 and older (56.2% in this age group)5,6
- 65.3 million women ages 18 and older (49.8% in this age group)5,6
- 508,000 American Indian or Alaska Native adults ages 18 and older (40.8% in this age group)5,6
- 6.2 million Asian adults ages 18 and older (40.3% in this age group)5,6
- 14.2 million Black or African American adults ages 18 and older (45.9% in this age group)5,6
- 90.2 million White adults ages 18 and older (57.0% in this age group)5,6
- 2.4 million adults of two or more races ages 18 and older (48.5% in this age group)5,6
- 21.8 million Hispanic or Latino adults ages 18 and older (49.2% in this age group)5,6
- Estimates for Native Hawaiian or other Pacific Islander adults ages 18 and older were not presented because they were based on a relatively small number of respondents or had a large margin of error.5,6
Prevalence of Past-Month Binge Drinking
People Ages 12 and Older
According to the 2022 NSDUH, 61.2 million people ages 12 and older (21.7% in this age group) reported binge drinking in the past month (see glossary for definition of binge drinking).7,8 This includes:
- 33.6 million males ages 12 and older (24.3% in this age group)7,8
- 27.5 million females ages 12 and older (19.2% in this age group)7,8
- 373,000 American Indian or Alaska Native people ages 12 and older (25.5% in this age group)7,8
- 1.8 million Asian people ages 12 and older (10.3% in this age group)7,8
- 7.2 million Black or African American people ages 12 and older (20.9% in this age group)7,8
- 38.5 million White people ages 12 and older (22.5% in this age group)7,8
- 1.2 million people of two or more races ages 12 and older (20.5% in this age group)7,8
- 11.8 million Hispanic or Latino people ages 12 and older (23.3% in this age group)7,8
- Estimates for Native Hawaiian or other Pacific Islander people ages 12 and older were not presented because they were based on a relatively small number of respondents or had a large margin of error.7,8
Youth Ages 12 to 17
According to the 2022 NSDUH, 834,000 youth ages 12 to 17 (3.2% in this age group) reported binge drinking in the past month (see glossary for definition of binge drinking).7,8 This includes:
- 337,000 boys ages 12 to 17 (2.6% in this age group)7,8
- 498,000 girls ages 12 to 17 (4.0% in this age group)7,8
- 9,000 American Indian or Alaska Native youth ages 12 to 17 (4.3% in this age group)7,8
- 17,000 Asian youth ages 12 to 17 (1.0% in this age group)7,8
- 47,000 Black or African American youth ages 12 to 17 (1.3% in this age group)7,8
- 519,000 White youth ages 12 to 17 (4.0% in this age group)7,8
- 32,000 youth of two or more races ages 12 to 17 (3.9% in this age group)7,8
- 210,000 Hispanic or Latino youth ages 12 to 17 (3.2% in this age group)7,8
- Estimates for Native Hawaiian or other Pacific Islander youth ages 12 to 17 were not presented because they were based on a relatively small number of respondents or had a large margin of error.7,8
Adults Ages 18 and Older
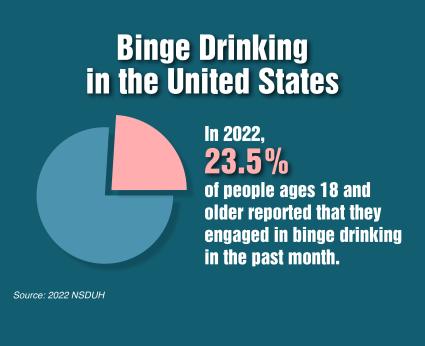
According to the 2022 NSDUH, 60.3 million adults ages 18 and older (23.5% in this age group) reported binge drinking in the past month (see glossary for definition of binge drinking).7,8 This includes:
- 33.3 million men ages 18 and older (26.6% in this age group)7,8
- 27.0 million women ages 18 and older (20.6% in this age group)7,8
- 363,000 American Indian or Alaska Native adults ages 18 and older (29.2% in this age group)7,8
- 1.7 million Asian adults ages 18 and older (11.3% in this age group)7,8
- 7.2 million Black or African American adults ages 18 and older (23.2% in this age group)7,8
- 38.0 million White adults ages 18 and older (24.0% in this age group)7,8
- 1.2 million adults of two or more races ages 18 and older (23.2% in this age group)7,8
- 11.6 million Hispanic or Latino adults ages 18 and older (26.3% in this age group)7,8
- Estimates for Native Hawaiian or other Pacific Islander adults ages 18 and older were not presented because they were based on a relatively small number of respondents or had a large margin of error.7,8
Prevalence of Past-Month Heavy Alcohol Use
People Ages 12 and Older
According to the 2022 NSDUH, 16.1 million people ages 12 and older (5.7% in this age group) reported heavy alcohol use in the past month (see glossary for definition of heavy alcohol use).9,10 This includes:
- 10.2 million males ages 12 and older (7.4% in this age group)9,10
- 5.9 million females ages 12 and older (4.1% in this age group)9,10
- 118,000 American Indian or Alaska Native people ages 12 and older (8.0% in this age group)9,10
- 323,000 Asian people ages 12 and older (1.9% in this age group)9,10
- 1.5 million Black or African American people ages 12 and older (4.2% in this age group)9,10
- 11.3 million White people ages 12 and older (6.6% in this age group)9,10
- 276,000 people of two or more races ages 12 and older (4.7% in this age group)9,10
- 2.3 million Hispanic or Latino people ages 12 and older (4.7% in this age group)9,10
- Estimates for Native Hawaiian or other Pacific Islander people ages 12 and older were not presented because they were based on a relatively small number of respondents or had a large margin of error.9,10
Youth Ages 12 to 17
According to the 2022 NSDUH, 63,000 youth ages 12 to 17 (0.2% in this age group) reported heavy alcohol use in the past month (see glossary for definition of heavy alcohol use).9,10 This includes:
- 33,000 boys ages 12 to 17 (0.2% in this age group)9,10
- 31,000 girls ages 12 to 17 (0.2% in this age group)9,10
- 0 Asian youth ages 12 to 17 (0.0% in this age group)9,10
- 3,000 Black or African American youth ages 12 to 17 (0.1% in this age group)9,10
- 39,000 White youth ages 12 to 17 (0.3% in this age group)9,10
- 2,000 youth of two or more races ages 12 to 17 (0.2% in this age group)9,10
- 45,000 Hispanic or Latino youth ages 12 to 17 (0.2% in this age group)9,10
- Estimates for American Indian or Alaska Native and Native Hawaiian or other Pacific Islander youth ages 12 to 17 were not presented because they were based on a relatively small number of respondents or had a large margin of error.9,10
Adults Ages 18 and Older
According to the 2022 NSDUH, 16.0 million adults ages 18 and older (6.3% in this age group) reported heavy alcohol use in the past month (see glossary for definition of heavy alcohol use).9,10 This includes:
- 10.2 million men ages 18 and older (8.1% in this age group)9,10
- 5.9 million women ages 18 and older (4.5% in this age group)9,10
- 114,000 American Indian or Alaska Native adults ages 18 and older (9.2% in this age group)9,10
- 323,000 Asian adults ages 18 and older (2.1% in this age group)9,10
- 1.5 million Black or African American adults ages 18 and older (4.7% in this age group)9,10
- 11.2 million White adults ages 18 and older (7.1% in this age group)9,10
- 274,000 adults of two or more races ages 18 and older (5.4% in this age group)9,10
- 2.6 million Hispanic or Latino adults ages 18 and older (5.8% in this age group)9,10
- Estimates for Native Hawaiian or other Pacific Islander adults ages 18 and older were not presented because they were based on a relatively small number of respondents or had a large margin of error.9,10
Emerging Trend—High-Intensity Drinking
High-intensity drinking is defined as consuming alcohol at levels that are two or more times the gender-specific binge drinking thresholds (see glossary for additional details about the definition of high-intensity drinking). Compared with people who did not binge drink, people who drank alcohol at twice the gender-specific binge drinking thresholds were 70 times more likely to have an alcohol-related emergency department visit, and those who consumed alcohol at three times the gender-specific binge thresholds were 93 times more likely to have an alcohol-related emergency department visit.11